Prometheus
ToolJet integrates with Prometheus to help you fetch and display metrics in your app. You can use this plugin to run PromQL queries and show real-time or historical data from your Prometheus server. It’s useful for building internal dashboards to monitor systems and track performance.
Before following this guide, it is assumed that you have already completed the process of Using Marketplace plugins.
Connection
Follow the steps in the Prometheus documentation to set up and run a Prometheus server.
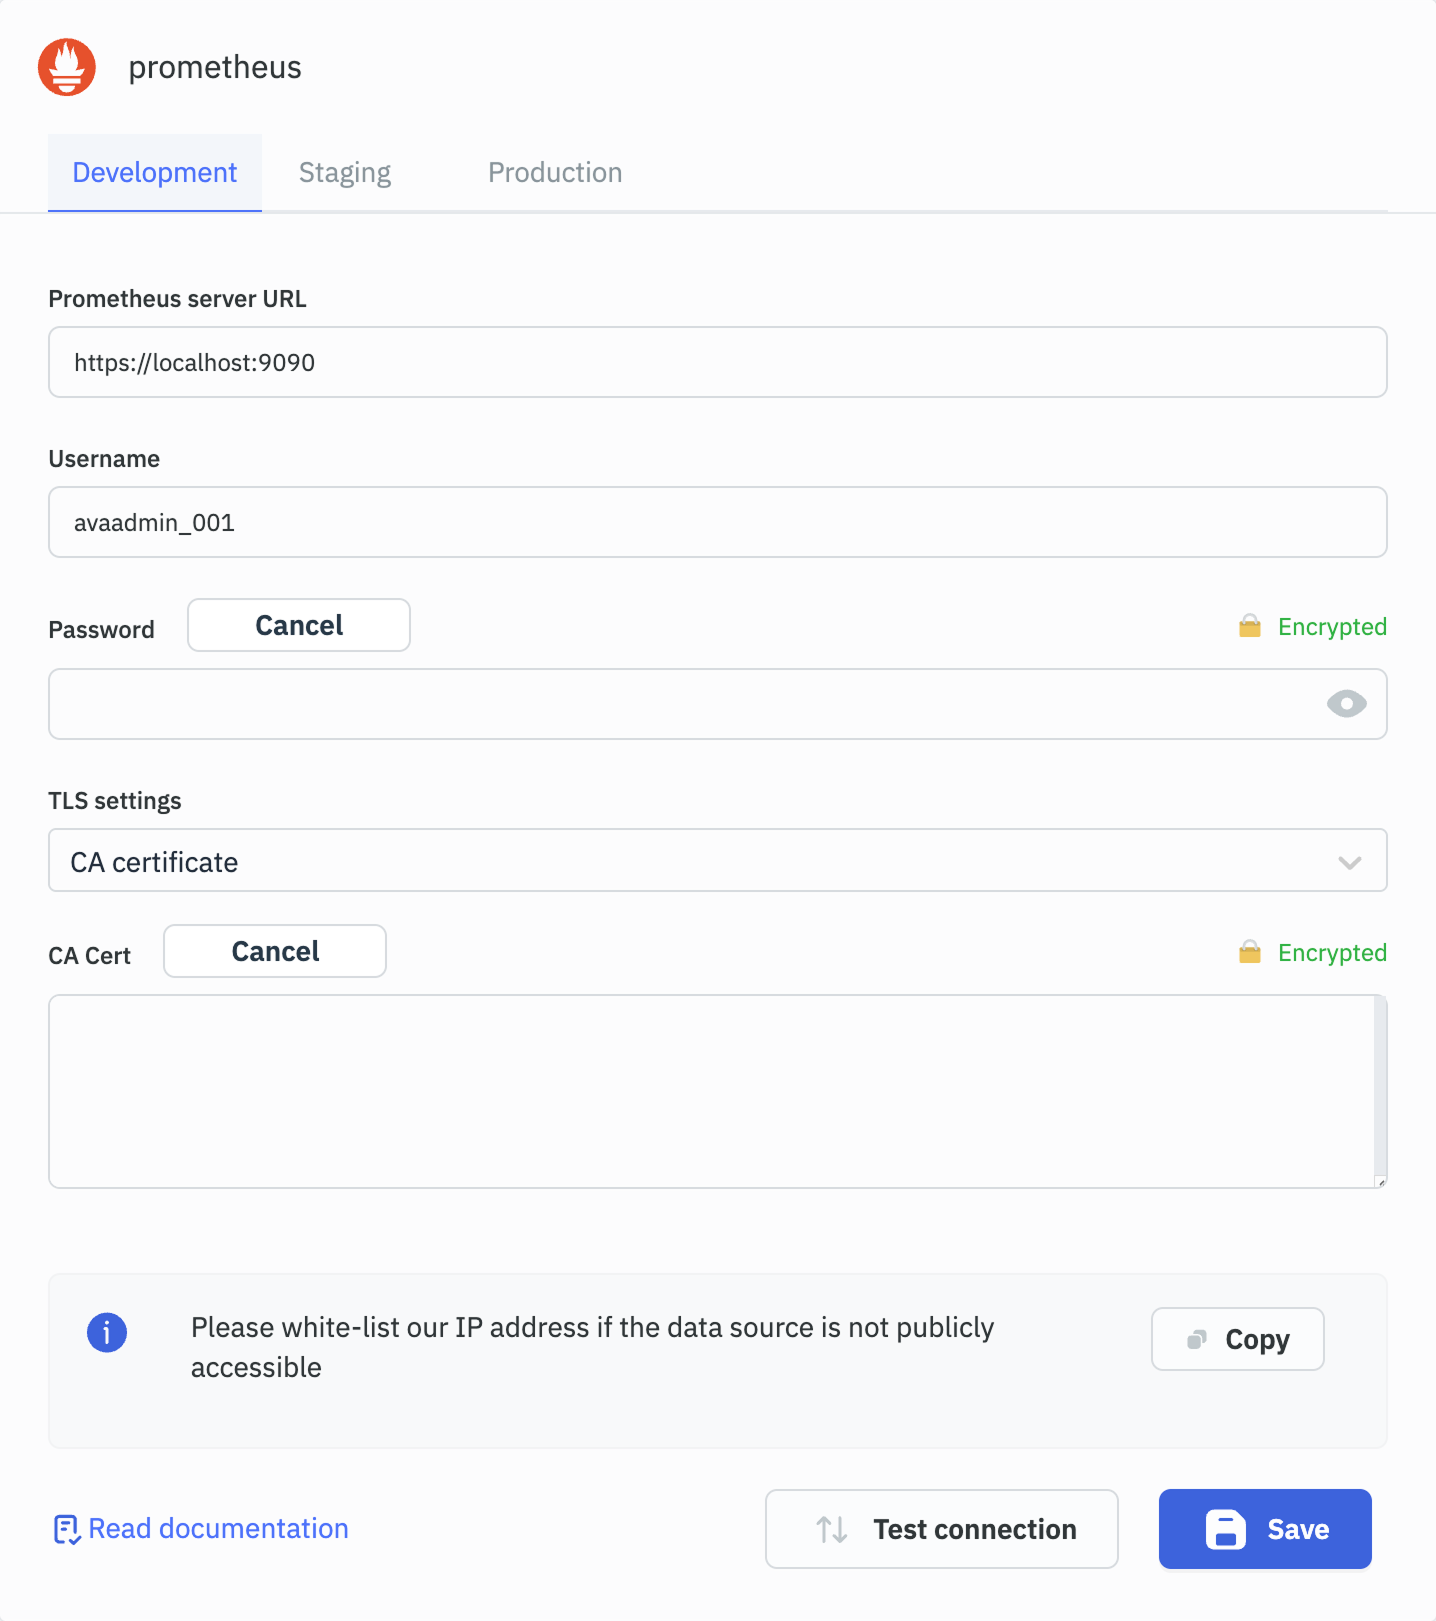
To connect Prometheus with ToolJet, you’ll need the following details:
- Prometheus server URL
- Username
- Password
- CA certificate or Client Certificate
Once connected, you can start using instant and range queries to fetch metric data from your server.
Supported Operations
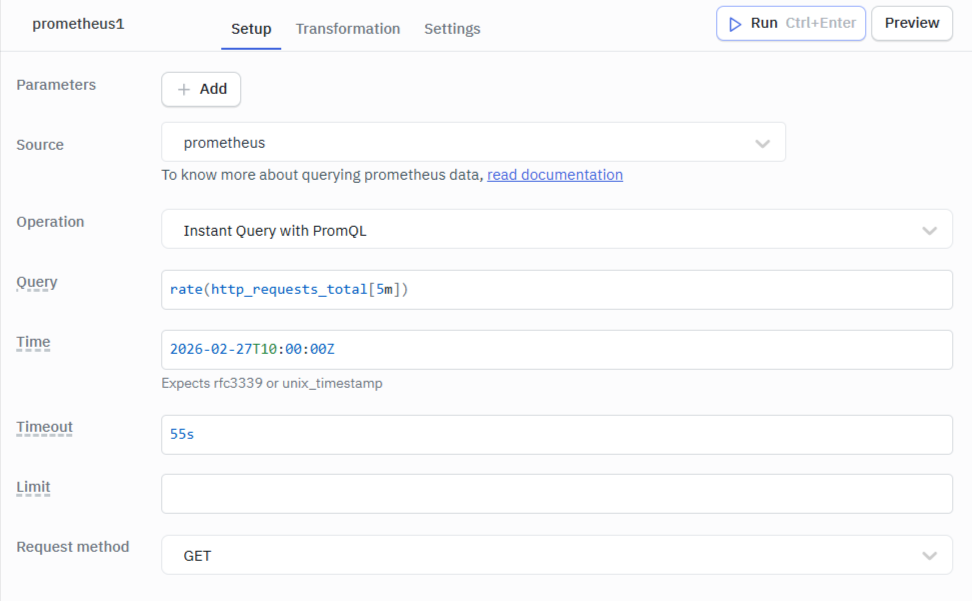
Instant Query with PromQL
Fetches the current value of a metric at a single point in time.
Required Parameters
- Query: A valid PromQL expression to fetch the metric.
- Request method: Defines how the request is sent (GET or POST).
Optional Parameters
- Time: Specific timestamp to evaluate the query against.
- Timeout: Maximum duration the query is allowed to run before timing out.
- Limit: Restricts the number of results returned.
Response Example
status : "success"
    data : {} 3 keys
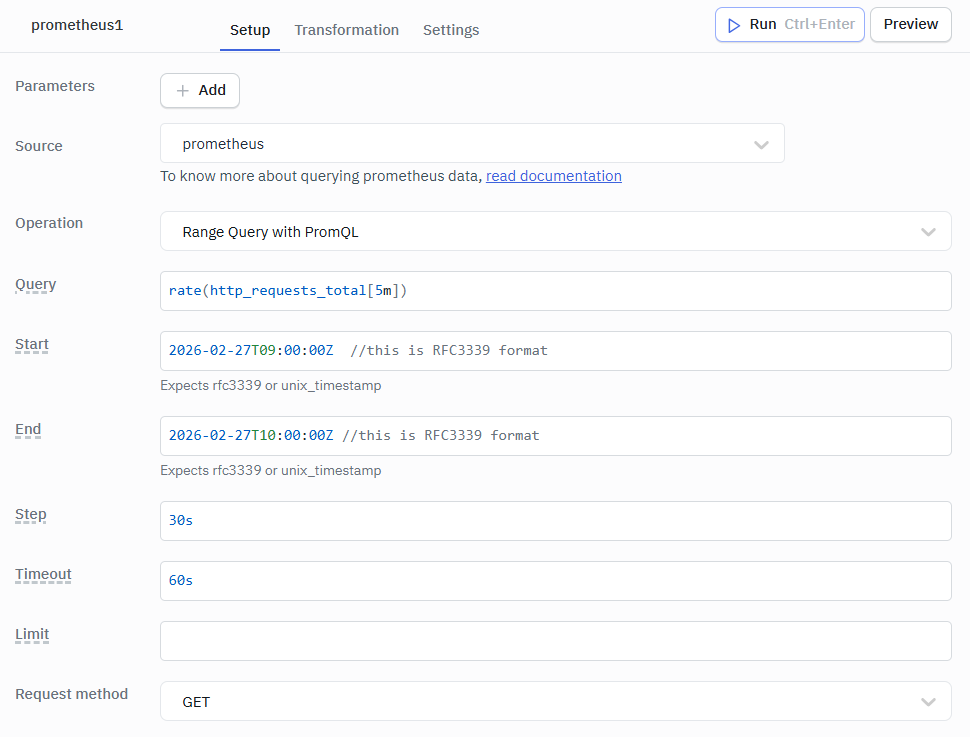
Range Query with PromQL
Retrieves metric data over a specified time range.
Required Parameters
- Query: A valid PromQL expression to fetch the metric.
- Start: Start timestamp of the time range.
- End: End timestamp of the time range.
- Step: Interval between data points within the time range.
- Request method: Defines how the request is sent (GET or POST).
Optional Parameters
- Timeout: Maximum duration the query is allowed to run before timing out.
- Limit: Restricts the number of results returned.
Response Example
status : "success"
    data : {} 2 keys